The Observers – Solar Report Archive – The Mobile Observatory Project

Learn about all the things you are seeing on this page in less than 1 hour.
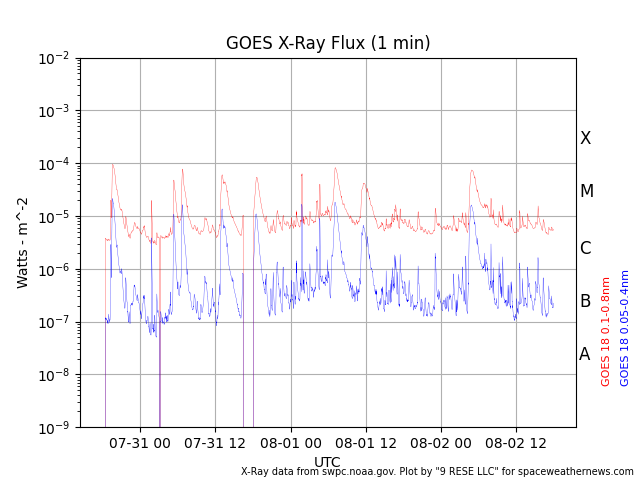
SOLAR FLARES (X-Rays) ~ Learn about solar flares here.
ENLIL Spiral | Magnetic Sector Boundaries and CME Events SAT ENV
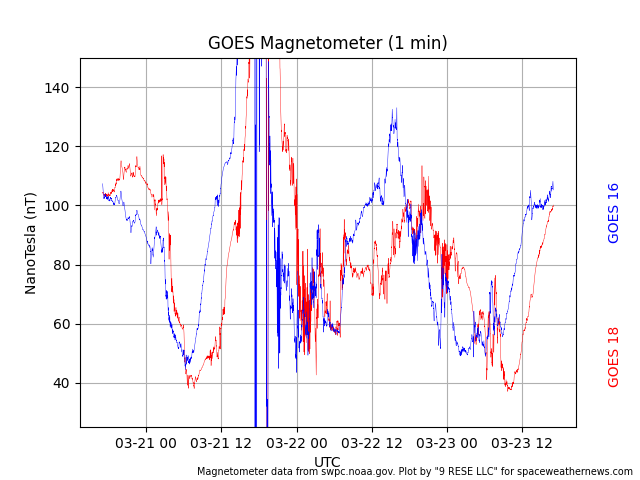
ACE MAG

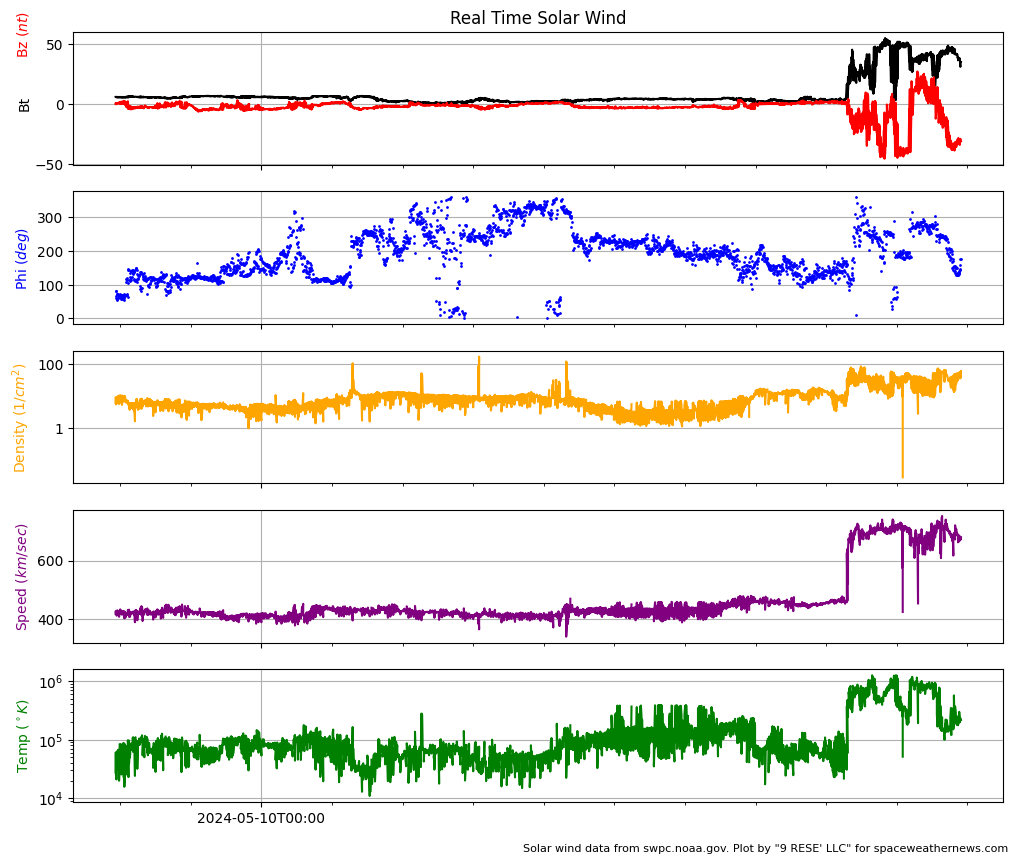
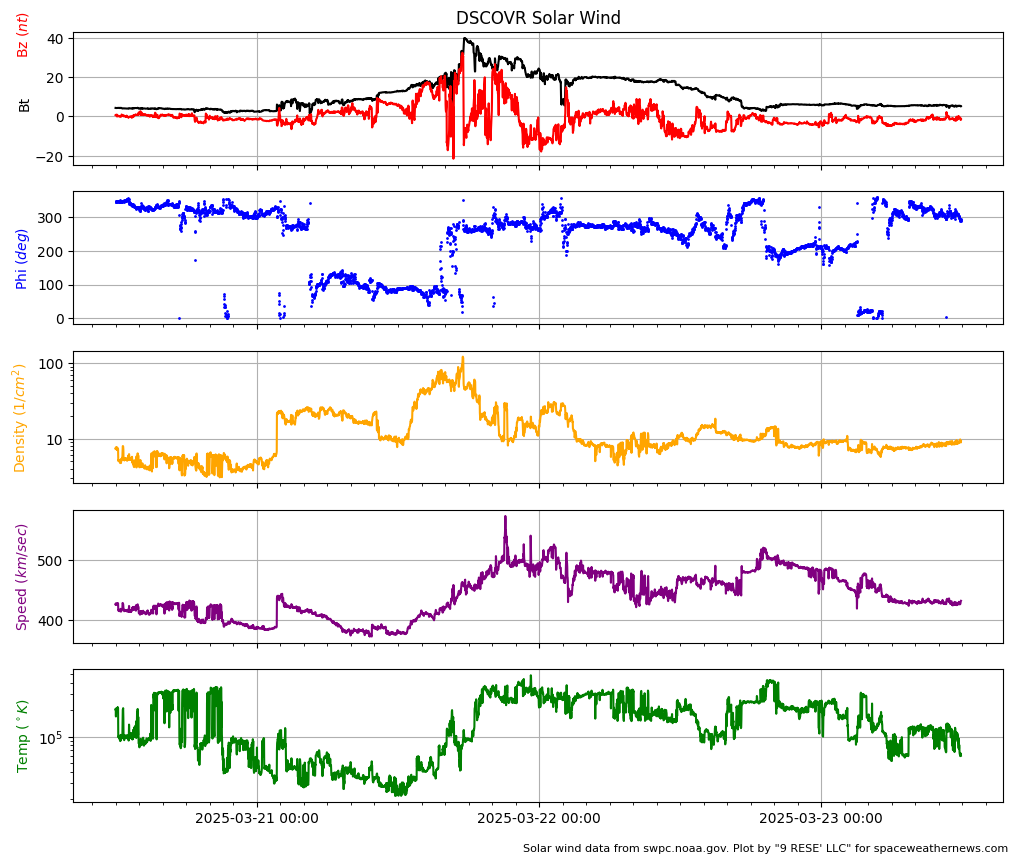
Learn About Solar Wind Here

[Red] Negative Bz Indicates Geomagnetic Effect

[Blue] Polar Angle (Phi) of the Magnetic Field

[Orange] Avg. Density is 0.1-10 protons

[Purple/Yellow] Avg. Speed is 350-400 km/sec

[Green] Avg. Temp <500,000 K

SAT ENV Space Weather disruptions show as large spikes. Space Weather calm shows as smooth curves.
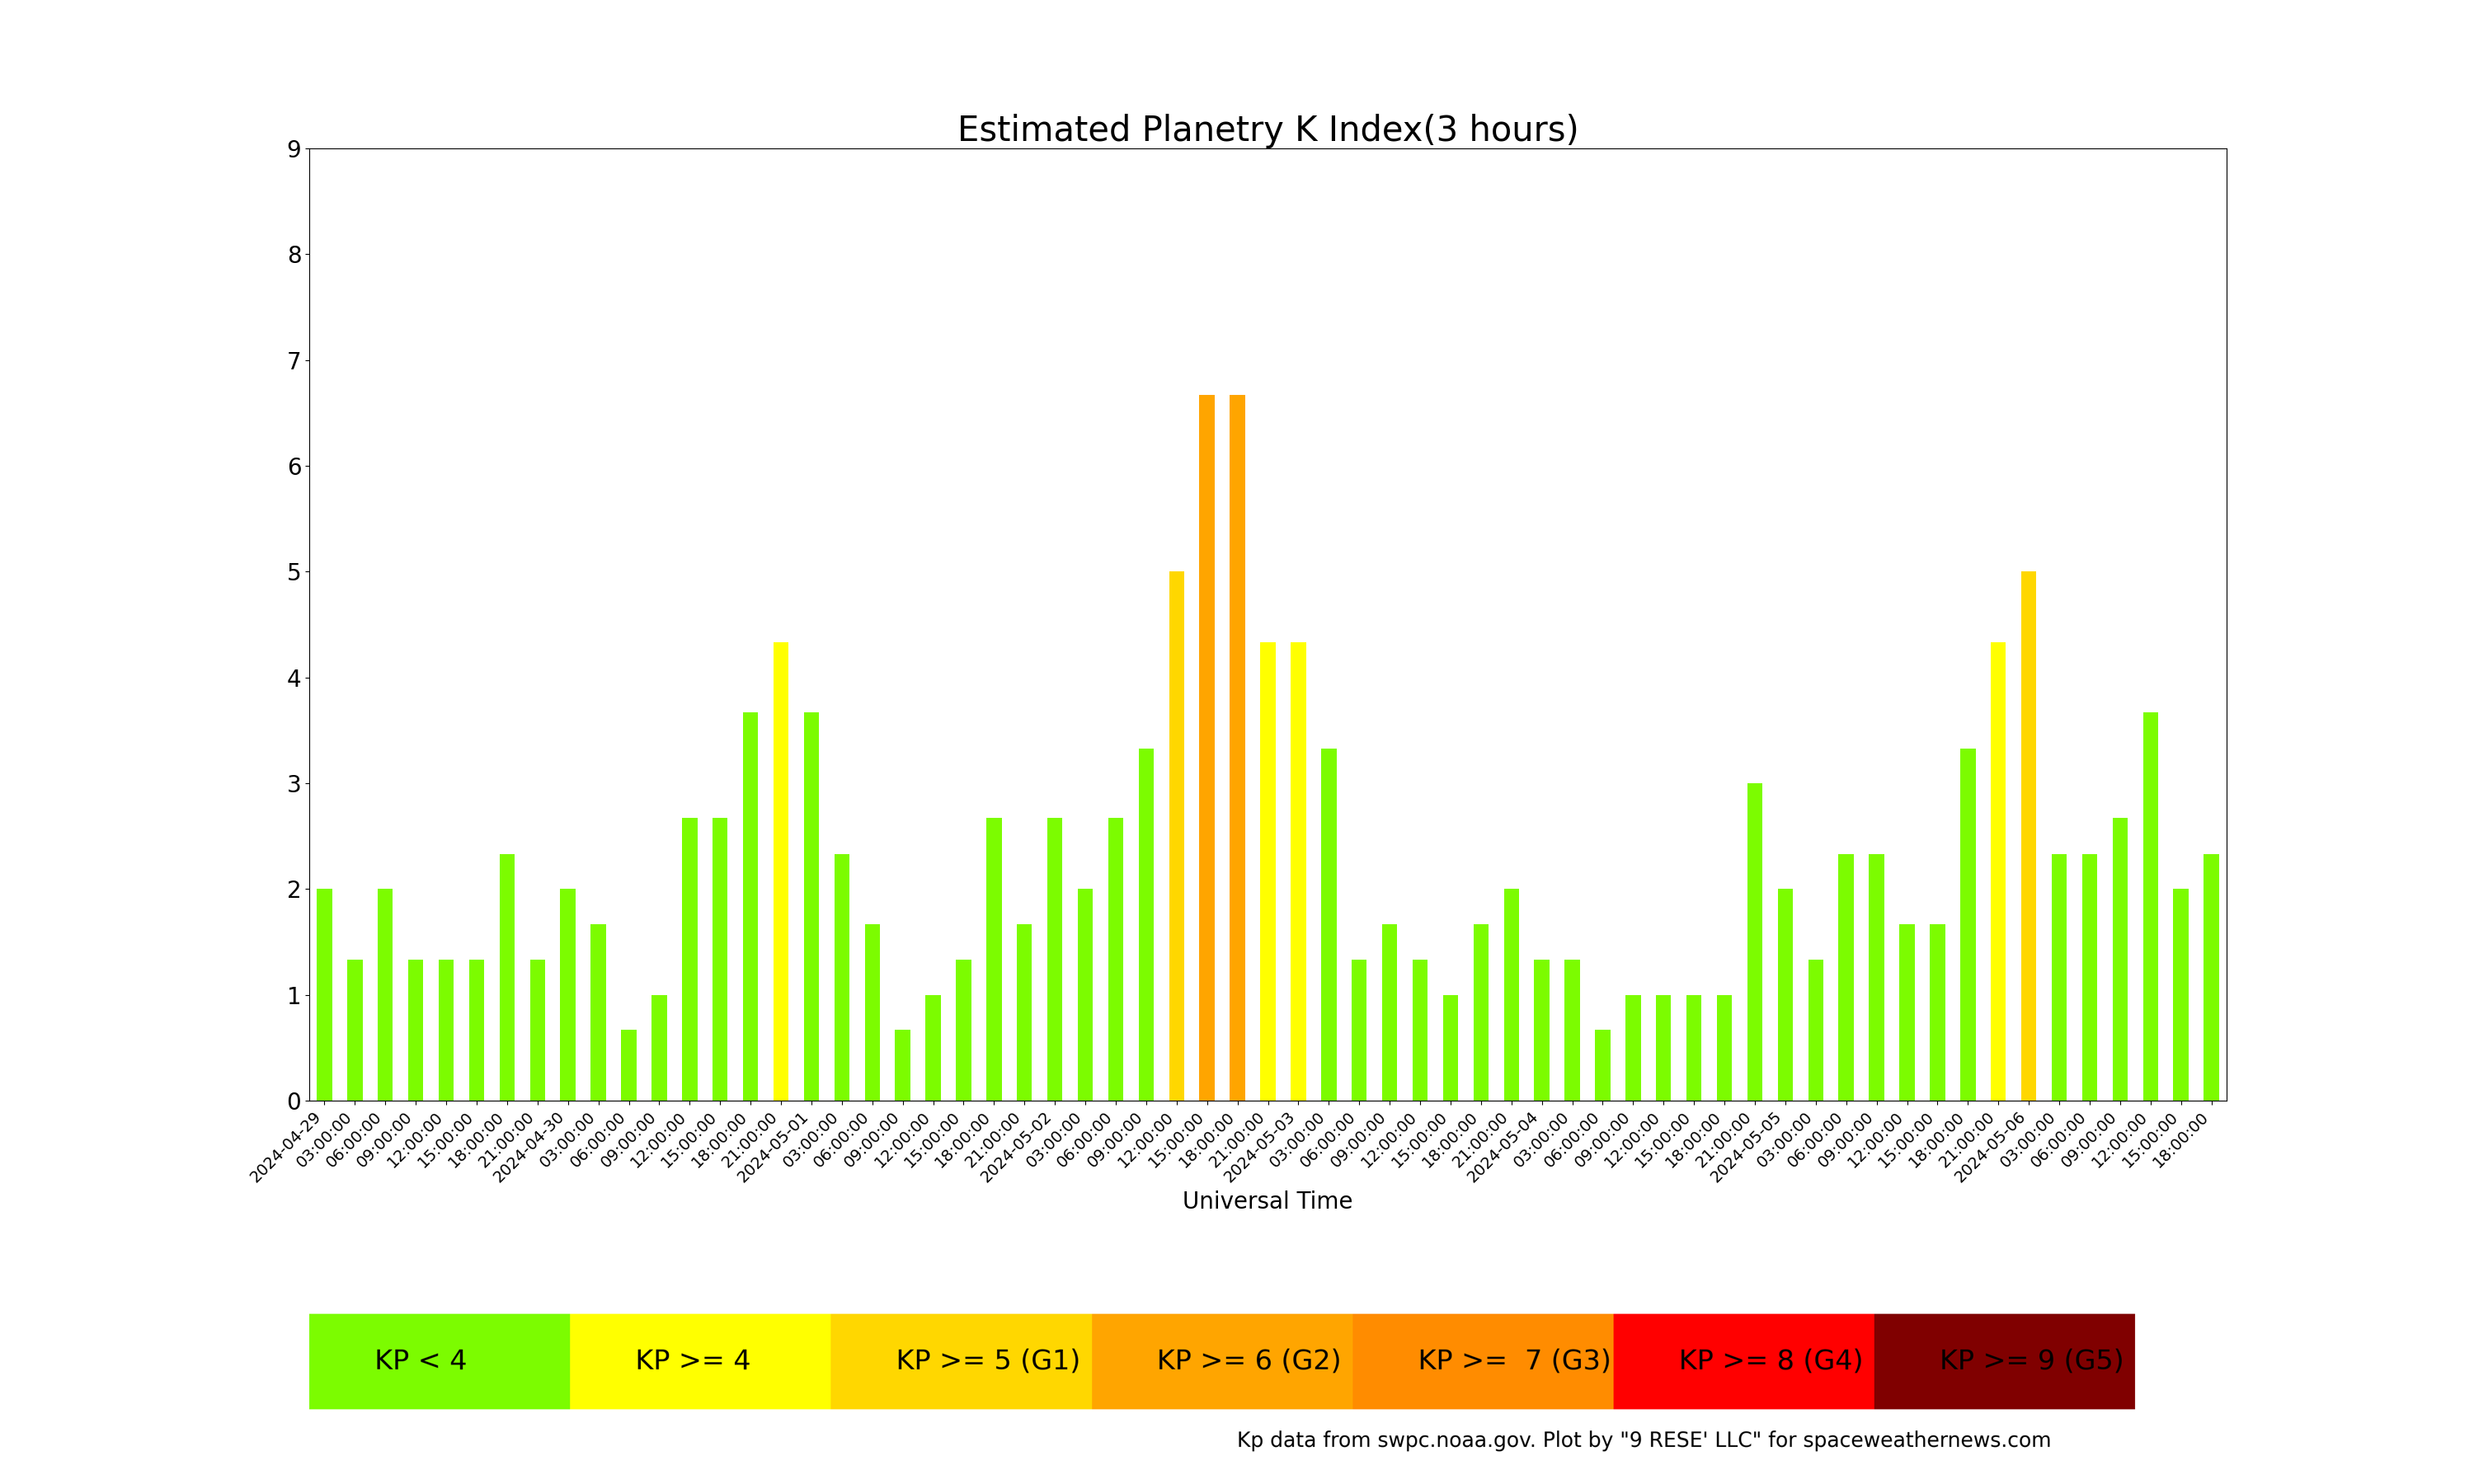
SAT ENV KP Index [0-3] Green - Stable/Calm Magnetosphere. [4] Yellow - Unstable Magnetosphere. [5+] Red - Geomagnetic Storm Conditions
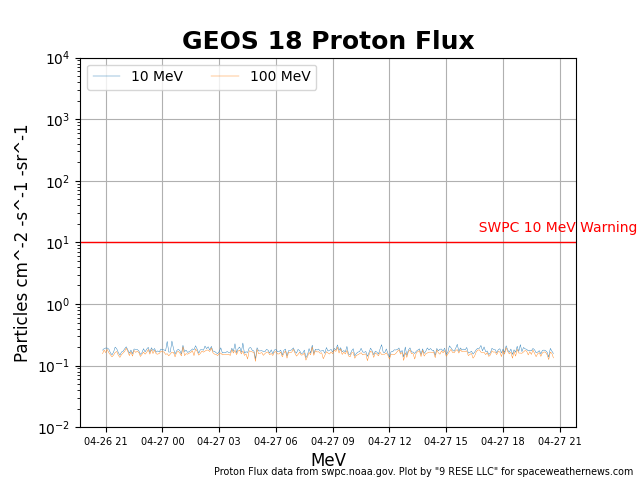
SAT ENV GOES Proton Flux - This shows the High Energy Proton bombardment. The dotted line represents the " level 1 radiation storm" baseline and each incremental level upward is another level of storm conditions.
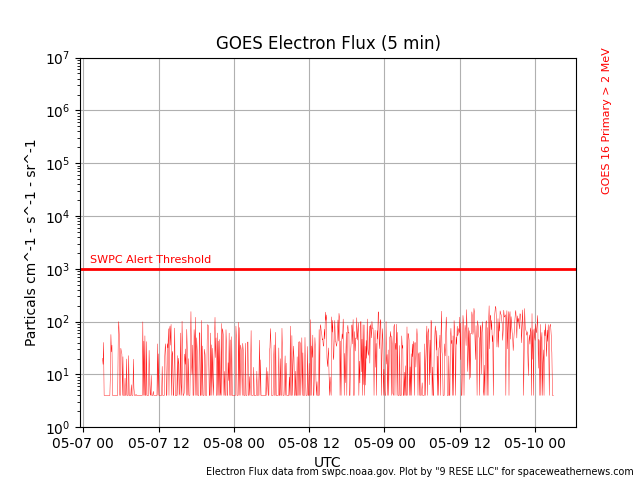
SAT ENV GOES Electron Flux This shows the High Energy Electron Bombardment. The radiation storm levels occur when the Red/Blue curves cross the dotted/hashed line. Each factor of 10 (next line up) represents a higher level of radiation storm.

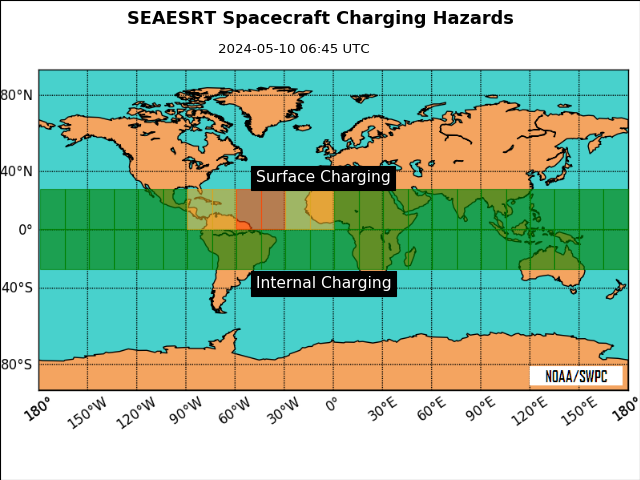
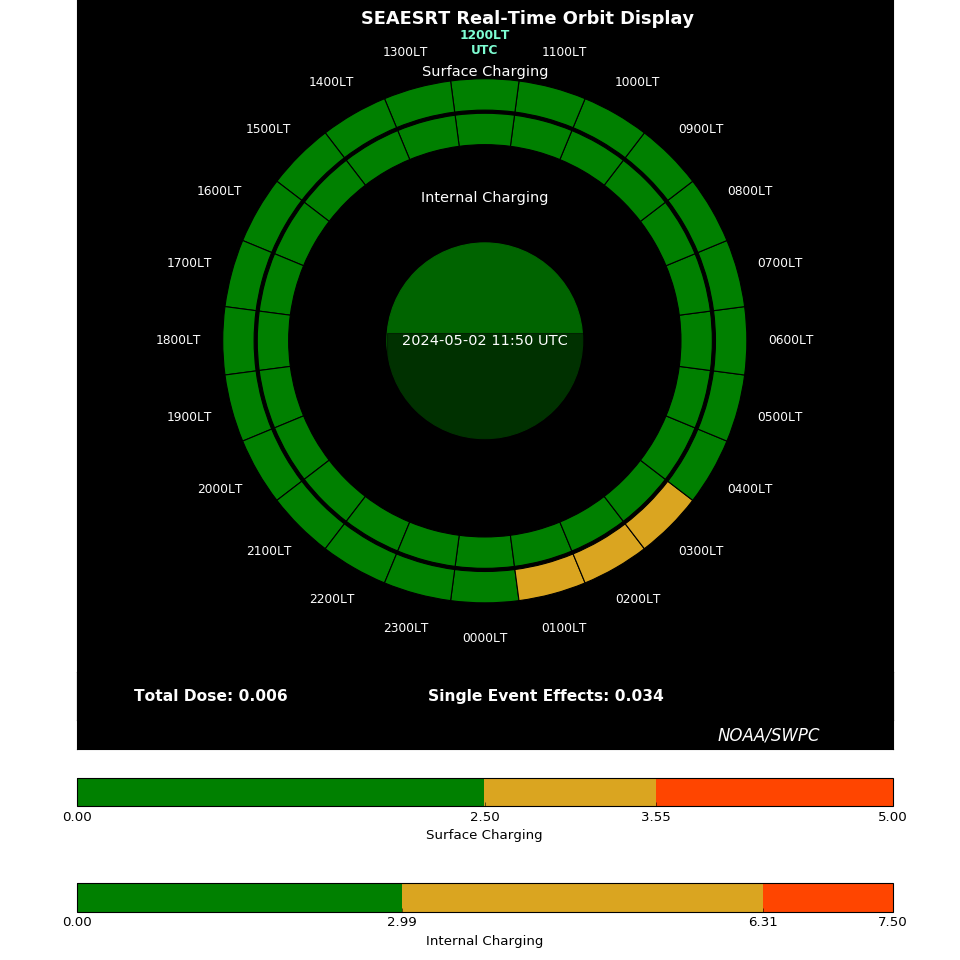
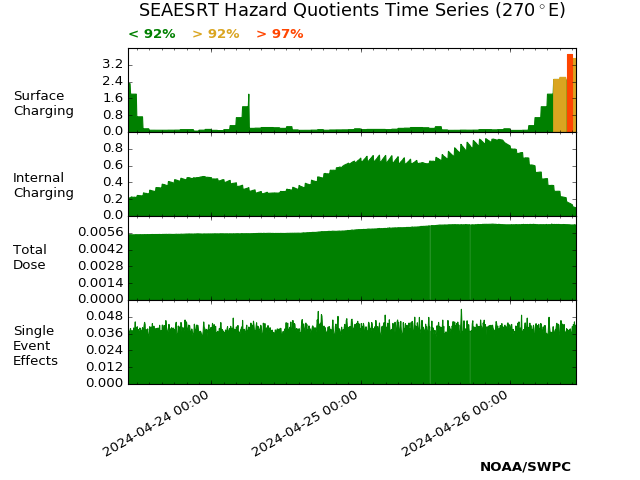
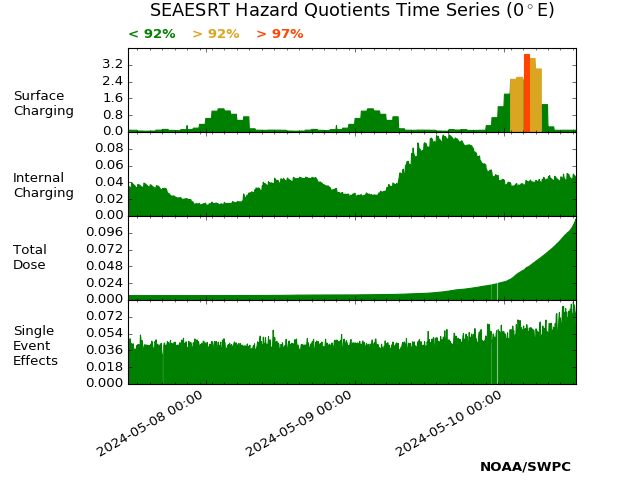
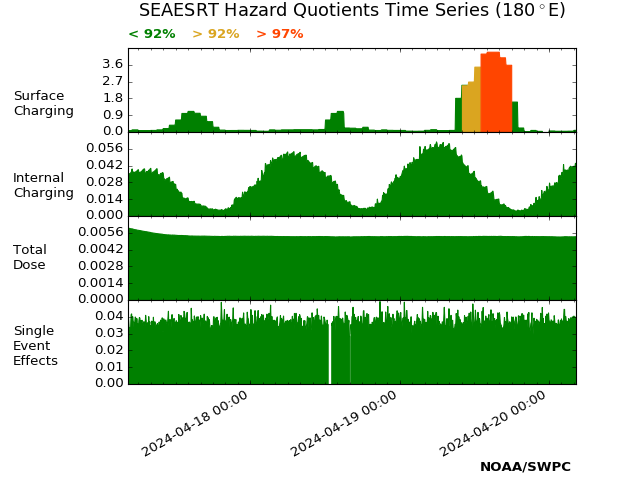
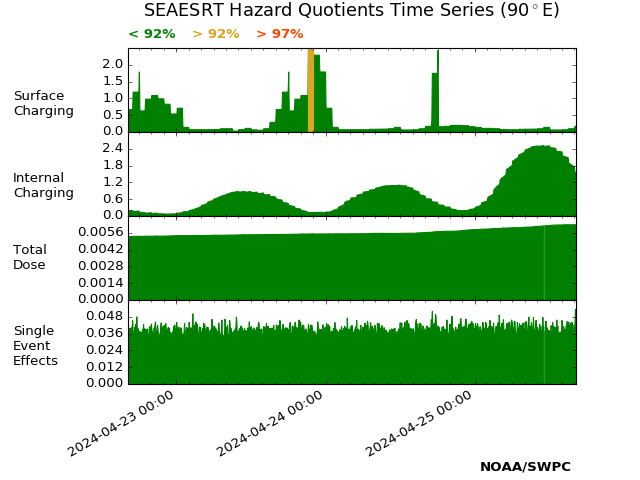
If a solar eruption is ever ACTUALLY going to affect earth’s power grid, the satellites will be affected first. See the spacecraft hazards charts below:

The 6 charts above are simple. Green is good. Yellow is approaching charging levels. Red is satellite charging hazard. If you see lots of Red here and a KP of 9 following a large solar flare or other solar eruption (and then your internet and power go down) there is a chance the sun has taken it away.

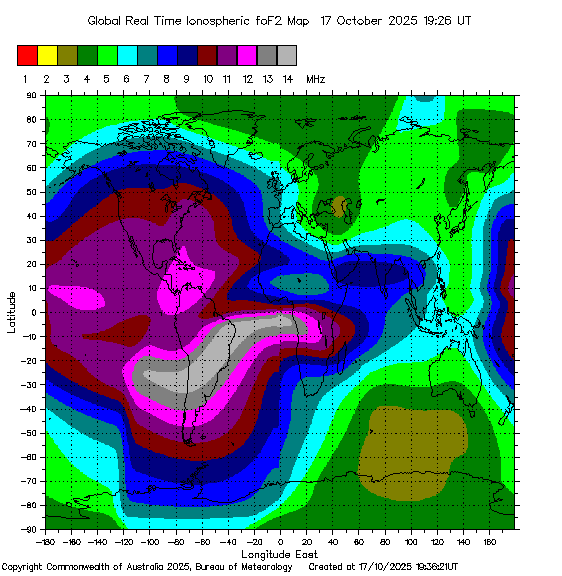
ACE MAG The chart above shows the critical frequency of the F2 ionospheric layer. Also see the explanation for the TEC display to the right of this panel.
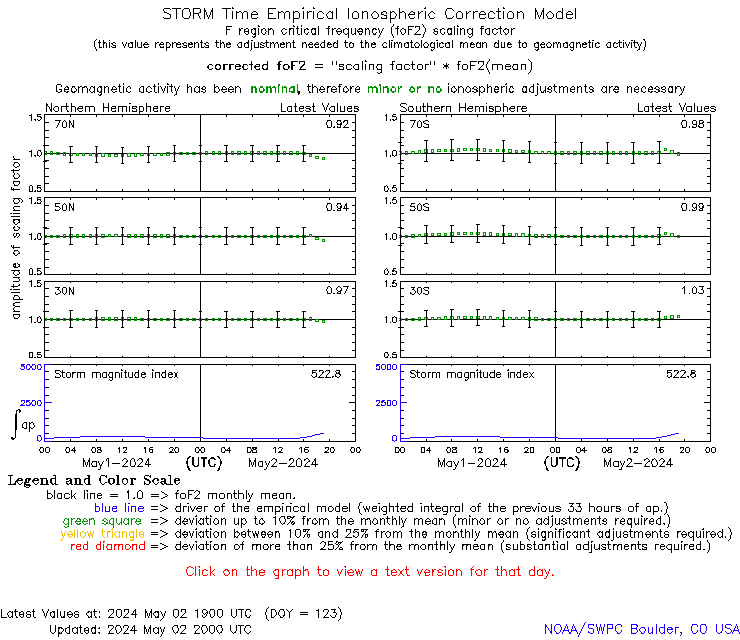
ACE MAG Quiet periods have smooth flat lines. The disruptions here are to the ionosphere.
ACE MAG This TEC chart is from the German Space Weather Application Center. With dozens of similar charts online.

Outgoing Longwave Radiation (OLR) has moved to QuakeWatch.net

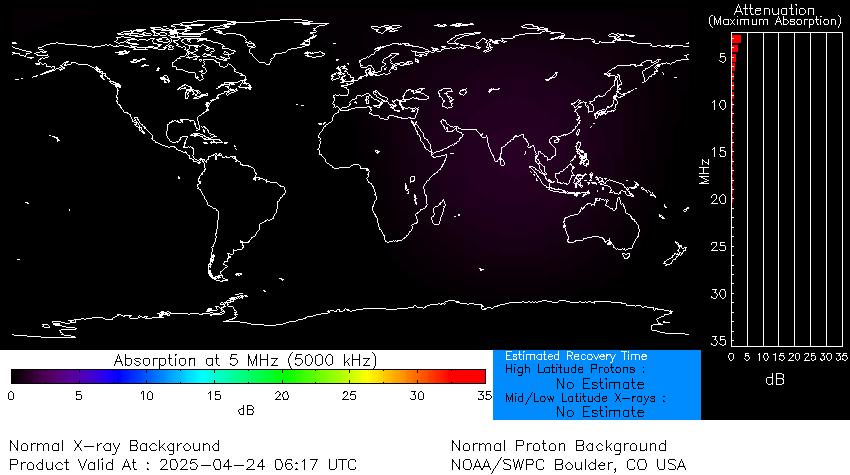
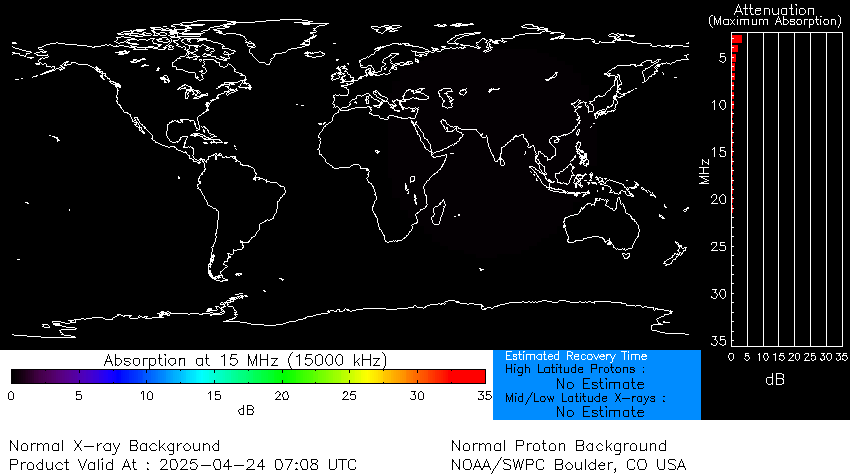
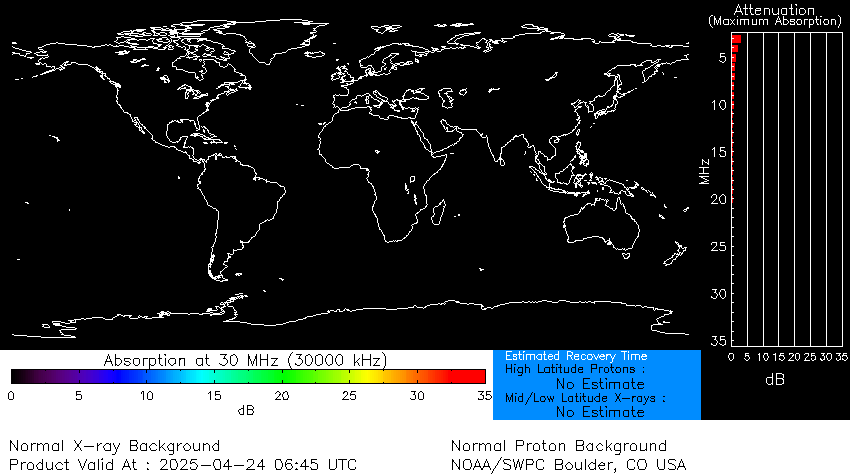
The Three D-RAP Charts above show Atmosphere and Ionosphere Effect from Space Weather. Top chart – always show any flare irradiance. Center chart – shows effects at radio blackout levels. The bottom chart – lights up during major events.

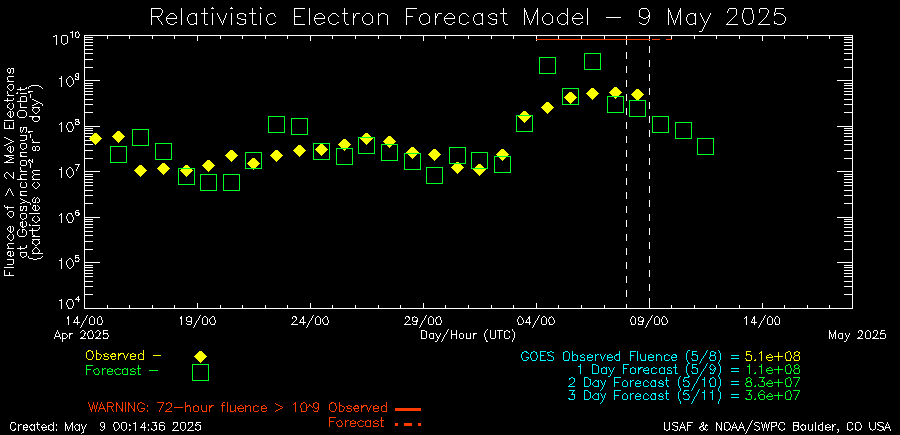
ACE MAG This chart shows the forecasted and observed high energy electron bombardment in near-earth space.

Communications Conditions courtesy of www.hamqsl.com/solar.html

Long-Term Solar Progression

ACE MAG A Year of solar wind from Solen.info
ACE MAG A Year of electron flux from Solen.info

This chart is yet another one from Solen.info – it shows the current solar cycle sunspot counts compared to previous cycles.

This free resource is supported by Suspicious0bservers.org.

Start typing and press Enter to search